This is the 3rd in a series of posts about query plans. The first post covered what a query plan is and how to read it. The second post described the effort required to make a query plan. This post will cover the plan cache.
If your server is running SQL Server 2016+ and you have enabled query store please STOP READING this post. Seriously. Query store changes and supersedes much of the information in this post. Instead, read about query store from the expert herself, Erin Stellato.
The plan cache is a list of query plans that have been compiled by the optimizer and may be reused without further compilation resources. This can speed up future query execution, especially with a workload that is highly repetitive.
Plan format
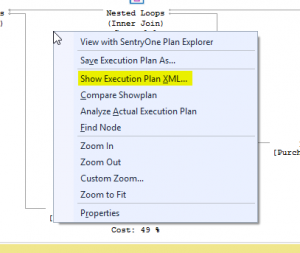
So far we’ve focused on the visual representation of query plans, but the plans are actually just XML. This XML can be viewed in SSMS by right clicking on white space of the visual representation and choosing “Show Execution Plan XML…”. It is this XML data that is stored in the plan cache.
Storage
The plan cache is stored only in memory and never persisted to disk. With many thousands of plans in cache it can take a very significant amount of memory to support the plan cache. Since the plans are only stored in memory they are completely wiped out upon a server or service restart. This is one of the reasons SQL Server performance tends to suffer immediately after a reboot. SQL Server will have a much larger workload in the short term while the plan cache is rebuilt.
These queries show the size of the plan cache.
SELECT COUNT(*) NumberOfPlansInCacheRightNow FROM sys.dm_exec_cached_plans
SELECT
*
FROM
sys.dm_os_memory_clerks
WHERE
[name] = 'SQL Plans'
The output of the memory clerks DMV will vary depending on the version of SQL Server.
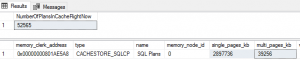 |
Here is a sample from SQL Server 2008 R2. On this system there are over 50,000 plans using just under 3GB of memory. |
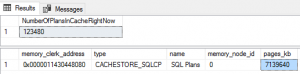 |
Here is a sample from SQL Server 2016. On this system there are over 100,000 plans using almost 7GB of memory. |
The XML for the individual plans in the cache can be viewed via this query. I have also included the use count and shredded out the compile time. Do you have any plans in your environment that have been used 100,000 times or more? If any of them have a significant compile time you can add up the overall time gained by reusing the plan rather than recompiling on every query execution.
WITH xmlnamespaces (default 'http://schemas.microsoft.com/sqlserver/2004/07/showplan')
SELECT TOP 100
a.usecounts
, COALESCE(plans.query_plan.value('(/ShowPlanXML/BatchSequence/Batch/Statements/StmtSimple/QueryPlan/@CompileTime)[1]', 'int'), 0) CompileTime
, a.size_in_bytes / 1024 SizeInKB
, plans.Query_plan
FROM
sys.dm_exec_cached_plans a
CROSS APPLY
sys.dm_exec_query_plan(plan_handle) plans
ORDER BY
usecounts DESC;
The SQL Server engine will keep as many plans in cache as there is room in memory to support. This memory requirement fights a zero sum game with the buffer pool so the plans can’t stay in cache forever. Much like how the buffer pool will age out less popular data, the plan cache will also age out less popular plans that haven’t been reused lately. There are other activities that will cause a plan to be ejected from the cache. A future post will detail several such scenarios.
The next post in this series will cover how the optimizer knows when an appropriate plan exists and how it is found so quickly.