The previous post in this series introduced the idea of query execution plans. These plans are compiled by the SQL Server optimizer when a query is executed in an effort to decide an efficient manner in which to execute a query. This compilation takes time and effort beyond that of actually running the query. While most compilation effort is relatively small, at times it can be significant and be an impetus to query performance. In this post we’ll offer methods to measure that time and effort.
The demos below utilize the WideWorldImporters DB that can be downloaded for free.
To follow along open SSMS, create a new query window connected to the WideWorldImporters instance, paste the following code the window, and execute the batch.
USE WideWorldImporters
GO
SET STATISTICS TIME ON
GO
SELECT
  a.OrderDate
, b.Description
, c.SupplierName
, a.ContactPersonID
, a.ExpectedDeliveryDate
, a.IsOrderFinalized
, a.Comments
FROM
  Purchasing.PurchaseOrders a
    INNER JOIN
  Purchasing.PurchaseOrderLines b ON a.PurchaseOrderID = b.PurchaseOrderID
    INNER JOIN
  Purchasing.Suppliers c ON a.SupplierID = c.SupplierID
WHERE
  ExpectedDeliveryDate = '2016-05-27'
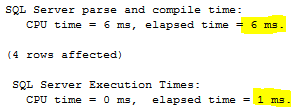
The query returns 4 rows. By including STATISTICS TIME we get extra information on the Messages output tab. We can see from the execution on my laptop that the optimizer took 6ms to compile a query plan and the actual query executed in only 1ms.
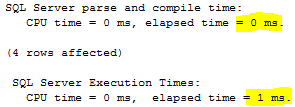
Run the query batch a few more times and notice that the parse and compile time drops to zero. This is because SQL Server keeps a list of compiled plans and tries to reuse them without having to recompile. In this case the optimizer has recognized that this query is exactly identical to one it has previously executed and it reuses the previously compiled plan. That list of plans is called the Plan Cache and will be covered in much more detail in a subsequent post.
We now have a query that shows 0ms to parse and compile (because it wasn’t compiled), but we can still determine the effort that was used to create this plan the first time. Use SSMS to view the plan by pressing Ctrl+M or clicking on the “Include Actual Execution Plan” button and execute the query again. Upon this execution a 3rd output tab is generated labeled Execution Plan. Note that our parse and compile time is still zero, yet a plan is clearly available to us. Click on this new tab and you will be presented with a visual representation of the query plan. Right click the Select item at the top left of the plan and choose properties. This new pane should appear on the right.
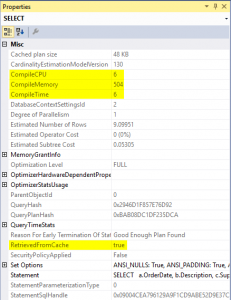 |
The plan offers even more detail about how much effort was involved in its initial creation, including the 6ms of time. It further tells us that this plan was retrieved from the plan cache and did not need to be recompiled for this query execution. |
While spending and then saving 6ms on a query execution may not seem like a big deal, in this case it accounts for an 87% decrease in user experience time. If this query is one that would run thousands of times per day those 6ms can really add up.
On other queries it can be much more than a few milliseconds. Below is a very poorly designed query with many subqueries which are notoriously troublesome for the optimizer. How long does this query take to compile on your system?
SELECT
a.OrderDate
, b.Description
, c.SupplierName
, d.SearchName
, a.ExpectedDeliveryDate
, a.IsOrderFinalized
, a.Comments
, (SELECT MIN(InvoiceDate) FROM Sales.Invoices WHERE CustomerPurchaseOrderNumber = a.PurchaseOrderID) FirstInvoiceForPO
, (SELECT MAX(InvoiceDate) FROM Sales.Invoices WHERE CustomerPurchaseOrderNumber = a.PurchaseOrderID) LastInvoiceForPO
, (SELECT DeliveryMethodName FROM Application.DeliveryMethods WHERE DeliveryMethodID = a.DeliveryMethodID) DeliveryMethod
, (SELECT LastEditedBy FROM Application.DeliveryMethods WHERE DeliveryMethodID = a.DeliveryMethodID) DeliveryMethodLastEditedBy
, (SELECT SearchName FROM Application.People WHERE PersonID = a.ContactPersonID) ContactPersonName
, (SELECT LogonName FROM Application.People WHERE PersonID = a.ContactPersonID AND IsPermittedToLogon = 1) ContactPersonLogon
, (SELECT FaxNumber FROM Application.People WHERE PersonID = a.ContactPersonID AND IsSalesperson = 0) ContactPersonFax
, (SELECT EmailAddress FROM Application.People WHERE PersonID = a.ContactPersonID AND ValidTo < '1/1/2200') ContactPersonEmail
, (SELECT FullName FROM Application.People WHERE PersonID = a.ContactPersonID AND isEmployee = 0) ContactPersonFullName
, (SELECT PreferredName FROM Application.People WHERE PersonID = a.ContactPersonID AND ValidFrom > '1/1/1790') ContactPersonPreferredName
FROM
Purchasing.PurchaseOrders a
INNER JOIN
Purchasing.PurchaseOrderLines b ON a.PurchaseOrderID = b.PurchaseOrderID
LEFT OUTER JOIN
(SELECT * FROM Purchasing.Suppliers WHERE ValidTo > '1/1/1800') c ON a.SupplierID = c.SupplierID
LEFT OUTER JOIN
(SELECT * FROM Application.People WHERE IsEmployee = 0) d ON a.ContactPersonID = d.PersonID
WHERE
a.ExpectedDeliveryDate = '2016-05-27'
OR
a.ContactPersonID = 5
The next post in this series will cover the plan cache in detail.
1 Comment